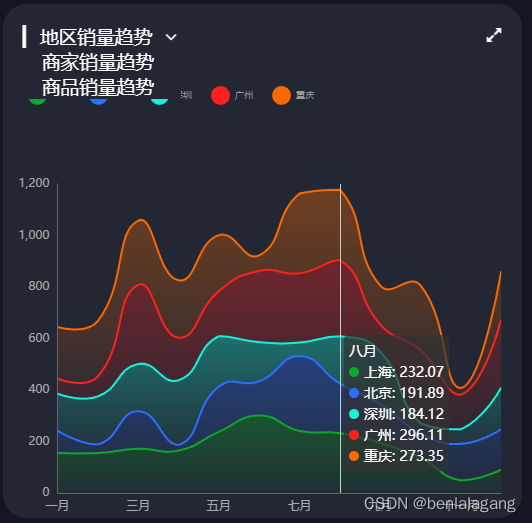
最终效果如图
组件结构设计
外部 Trendpage.vue
<!--针对于/trendpage 这条路径显示 测试显示组件-->
<template>
  <div class="comP1">
<Trend></Trend>
  </div>
</template>
<script>
  import Trend from "@/components/Trend";
  export default {
name: "TrendPage",
components:{Trend}
  }
</script>
<style scoped>
</style>
内部Trend.vue
<!-- 显示地区销量趋势的折线图表 -->
<template>
<div class="comP2" ref="trend_1"></div>
</template>
<script>
export default {
data () {
return {}
},
methods: {}
}
</script>
<style lang="less" scoped>
</style>
初始化图表+数据的获取+更新图表
设置好这些函数 在mounted生命周期内调用
mounted() {
  // 渲染DOM元素之后 初始化图表实例 请求数据 监听页面尺寸变化
  this.initChart()
   this.getData()  // 请求数据
  // 监听图表尺寸发生变化时的 处理函数   自适应尺寸
  window.addEventListener('resize',this.screenAdapter)
  this.screenAdapter()
},
找到盒子初始化图表、这里只是简单设置的直角坐标系
  initChart(){
this.chartInstance = this.$echarts.init(this.$refs.trend_1,this.theme)
const initOption = {
  grid:{
left:'3%',
top:'35%',
right:'4%',
bottom:'1%',
containLabel:true
  },
  tooltip:{ // 鼠标悬浮时的提示框
trigger:'axis'
  },
  legend:{
left: 20,
top: '15%',
icon:'circle'
  },
  xAxis: {
type:'category',
boundaryGap:false // 紧贴两侧边缘
  },
  yAxis:{
type:'value'
  }
}
this.chartInstance.setOption(initOption)
  },
发送请求、获取数据
  getData(){
const {data:res} = await this.$http.get('trend')
this.allData = res
this.updateChart()
  },
请求过来的数据:
{
"map": {
"title": "地区销量趋势",
"base": 310,
"unit": "万",
"data": [{
"name": "上海",
"data": ["155.13","154.65","171.46","164.38","237.23","300.65","240.29","232.07","193.31","136.70","48.64","90.20"]
}, {
"name": "北京",
"data": ["86.25","33.80","145.58","21.79","176.09","132.41","291.05","191.89","151.54","94.25","141.75","157.14"]
}, {
"name": "深圳",
"data": ["143.94","186.29","183.64","251.48","195.48","152.16","52.47","184.12","203.79","39.16","56.37","161.64"]
}, {
"name": "广州",
"data": ["57.60","77.61","307.24","165.05","175.41","276.88","269.04","296.11","105.31","283.39","134.08","265.38"]
}, {
"name": "重庆",
"data": ["200.82","215.56","249.80","222.67","216.98","60.12","309.68","273.35","150.99","251.97","26.15","186.99"]
}]
},
"seller": {
"title": "商家销量趋势",
"base": 120,
"unit": "万",
"data": [{
"name": "商家1",
"data": ["33.00","86.07","28.77","34.29","102.45","0.30","50.50","21.70","25.41","25.71","66.90","63.29"]
}, {
"name": "商家2",
"data": ["12.83","102.42","37.37","95.55","45.45","112.72","113.53","106.41","75.67","113.91", "37.32", "28.04"]
}, {
"name": "商家3",
"data": ["73.54","40.92","89.81","113.41","76.34","107.15","55.61","0.33","106.29","78.30","98.05","38.67"]
}, {
"name": "商家4",
"data": ["47.19","73.57","44.60","84.03","62.82","15.65","64.72","88.98","29.25","5.41","79.11","118.46"]
}, {
"name": "商家5",
"data": ["74.84","116.45","107.69","11.03","17.31","42.22","97.60","108.64","43.87","110.65","5.96","38.41"]
}]
},
"commodity": {
"title": "商品销量趋势",
"base": 50,
"unit": "万",
"data": [{
"name": "女装",
"data": ["47.71","13.34","19.30","7.93","41.93","23.01","22.63","26.91","0.62","39.23","48.74","29.48"]
}, {
"name": "手机数码",
"data": ["46.66","46.52","23.65","1.73","44.26","47.07","17.86","40.20","3.78","31.46","28.01","8.63"]
}, {
"name": "男装",
"data": ["26.98","30.71","42.59","29.50","26.86","17.65","30.15","15.85","9.28","30.20","32.35","34.46"]
}, {
"name": "大家电",
"data": ["20.26","46.23","43.84","46.75","28.29","32.36","45.30","16.73","40.40","45.07","29.86","41.92"]
}, {
"name": "美妆护肤",
"data": ["7.58","23.66","39.78","30.20","25.72","36.20","47.55","35.39","27.85","37.56","16.91", "3.91"]
}]
},
"common": {
"month": ["一月", "二月", "三月", "四月", "五月", "六月", "七月", "八月", "九月", "十月", "十一月", "十二月"]
},
"type": [{
"key": "map",
"text": "地区销量趋势"
}, {
"key": "seller",
"text": "商家销量趋势"
}, {
"key": "commodity",
"text": "商品销量趋势"
}]
}
数据请求过来后在进行 相应处理 渲染图表
data中预留的变量:
data(){
  return{
chartInstance:null,// 预留初始化实例对象
allData:null, // 服务器请求过来的数据
showChoice:false, // 是否显示可选项
choiceType:'map', // 显示的数据类型
titleFontSize:0 // 指明标题的字体
  }
},
1.准备好两个数组 颜色透明度 0.5 ->0.1
2.抽取时间轴的数据
3.抽取组合 series 系列的数组
4.抽取 legend 分类提示
5.重新生成 option 调用 setOption 渲染图表
  updateChart(){
// 数据更新时 重新渲染
// 预设半透明颜色的值
const colorArr1 = [
  'rgba(11,168,44,0.5)',
  'rgba(44,110,255,0.5)',
  'rgba(22,242,217,0.5)',
  'rgba(254,33,30,0.5)',
  'rgba(250,105,0,0.5)'
]
// 预设全透明颜色的值
const colorArr2 = [
  'rgba(11,168,44,0.1)',
  'rgba(44,110,255,0.1)',
  'rgba(22,242,217,0.1)',
  'rgba(254,33,30,0.1)',
  'rgba(250,105,0,0.1)'
]
// 处理请求过来的 this.allData 数据 直接用变量 导进设置中
const timeArr = this.allData.common.month // 类目轴的月份
const valueArr = this.allData[this.choiceType].data // 数值轴的数据
const seriesArr = valueArr.map((item,index) => {
  return {
type:'line', // 类型是折线图
data:item.data, // 数据是每一项的data
stack:this.choiceType, // 设置成堆叠图一样的字符串就可以
name:item.name, // 每一项的提示 name
// 每一项面积颜色的设置 运用到 上面定义的两个数组
areaStyle:{
  color:new this.$echarts.graphic.LinearGradient(0,0,0,1,[
{
  offset:0,
  color:colorArr1[index]
},
{
  offset:1,
  color:colorArr2[index]
}
  ])
}
  }
})
const legendArr = valueArr.map(item => {
  return item.name
})
const dataOption = {
  xAxis: {
data:timeArr
  },
  legend:{
data:legendArr
  },
  series:seriesArr
}
this.chartInstance.setOption(dataOption)
  },
尺寸变化的适配-第三篇文章已经详细讲过
  screenAdapter(){
// 页面分辨率发生改变时 重新渲染
this.titleFontSize = this.$refs.trend_1.offsetWidth / 100 * 3.6
const adapterOption = {
  // legend 是提示类目的文字 可以总的设置 也可以在单独的 series 里设置
  legend: {
itemWidth: this.titleFontSize,
itemHeight: this.titleFontSize,
itemGap: this.titleFontSize,
textStyle: {
  fontSize: this.titleFontSize / 2
}
  }
}
this.chartInstance.setOption(adapterOption)
this.chartInstance.resize()
  },
标题显示以及对于数据的切换操作
请求过来的数据当中 有 三种类型 map seller commodity 默认是 map
在template 当中添加 标题选择模块 附加一定的样式 使得标题显示在对应的位置
- 整体的 位置 由title 样式决定 动态样式 comStyle 会随着窗口变化和主题切换而改动
- showTitle 根据this.choiceType 动态决定标题
- icon-font 字体图标 小箭头 点击切换 下拉标题的选择
- v-for 渲染下拉标题 过滤掉当前选择的标题
- 为每一小项 添加点击事件 传入 对应的key 更新this.choiceType 后重新渲染图标 并隐藏下拉
<template>
<div class="comP3">
<div class="title" :style="comStyle">
<span>{{'▎ ' + showTitle}}</span>
<span class="iconfont title-icon" :style="comStyle" @click="showChoice = !showChoice"></span>
<div class="select-con"
:style="theme === 'chalk' ? 'background-color: #222733;' : 'background-color: #ffffff;'"
v-show="showChoice">
<div class="select-item" :style="marginStyle" v-for="item in selectTypes" :key="item.key" @click="handleSelect(item.key)">
{{item.text}}
</div>
</div>
</div>
<div class="comP2" ref="trend_1"></div>
</div>
</template>
<style scoped lang="less">
.title {
position: absolute;
left: 20px;
top: 20px;
z-index: 10;
cursor: pointer;
user-select: none;
color: white;
.title-icon {
margin-left: 10px;
}
.select-con {
/*background-color: #222733;*/
}
}
</style>
与之对应的计算属性和方法:
computed:{
  ...mapState(['theme']),
  // 准备遍历选项的 元数据
  selectTypes(){
if (!this.allData){
  return []
}else {
  return this.allData.type.filter(item =>{
return item.key !== this.choiceType
  })
}
  },
  // 显示当前选中的标题
  showTitle(){
if(!this.allData){
  return ''
}else {
  return this.allData[this.choiceType].title
}
  },
  // 设置给标题的样式
  comStyle(){
return `font-size:${this.titleFontSize}px;color:${getThemeValue(this.theme).titleColor}`
  },
  marginStyle(){
return `padding-left:${this.titleFontSize}px`
  },
},
methods:{
  handleSelect(currentType){
this.choiceType = currentType
this.updateChart()
this.showChoice = false
  }
}
 从承欢自己开始
 商女今棠
商女今棠 熊孩子带来的初恋
 嫁给敌国太子后,皇兄黑化了
 穿成绿茶她妈,我开启拯救计划
 绿茶学妹毁了我的苏绣
 被逼入宫殉葬,我手刃狗皇帝
 退婚世子后,她改嫁朝中摄政王
 九爷的狂妻马甲多
 许夏锦吴纪
许夏锦吴纪 后宫独宠:暴君私底下是小奶狗
 绝世高手张宇
 广城的初夏都特别热许雨晴
 虞溪蔷沈泊礼
 天才萌宝:妈咪只想当咸鱼
 我穿成了小说里的贫穷路人甲