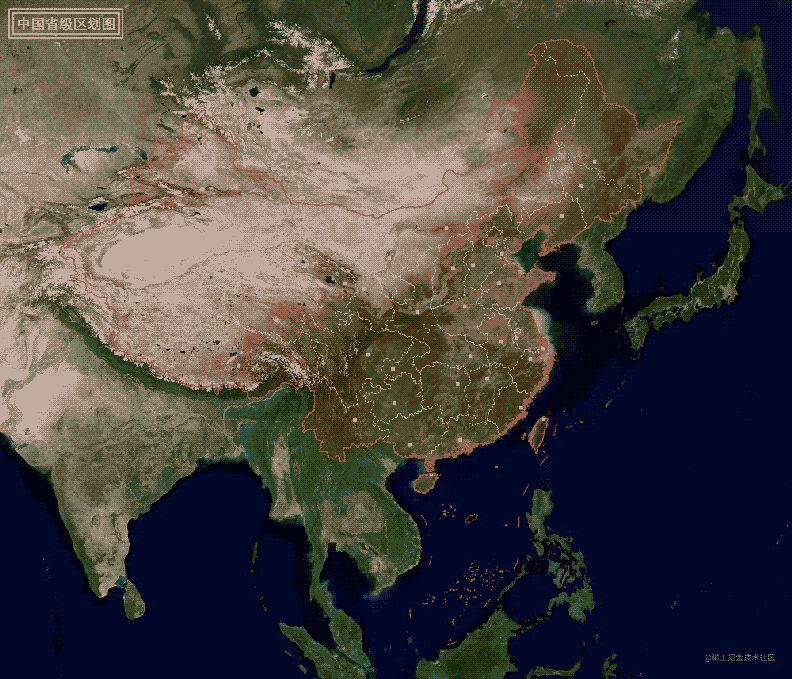
本文讲述在node中,使用canvas实现根据出图范围和级别,拼接瓦片并叠加geojson矢量数据,并导出成图片。
实现效果
实现
1. 初始化工程
通过命令npm init -y初始化工程并添加对应的依赖,最终的package.json文件如下:
{
  "name": "map",
  "version": "1.0.0",
  "description": "",
  "main": "map.js",
  "scripts": {
"map": "node ./map.js"
  },
  "keywords": ["canvas", "map"],
  "author": "lzugis<niujp08@qq.com>",
  "license": "ISC",
  "dependencies": {
"canvas": "^2.9.3",
"proj4": "^2.8.0",
"ora": "^5.4.0"
  }
}
2. 编写工具类
canvas.js,canvas操作工具,主要实现canvas画布初始化,并实现了添加图片 、绘制点、绘制线、绘制面等方法。
const { createCanvas, loadImage } = require('canvas')
class CanvasUtil {
  constructor(width = 1000, height = 1000) {
this.canvas = createCanvas(width, height)
this.ctx = this.canvas.getContext('2d')
  }
  /**
   * 绘制多个图片
   * @param imgsData, [{url: '', x: '', y: ''}]
   * @return {Promise<unknown>}
   */
  drawImages(imgsData) {
const that = this
let promises = []
imgsData.forEach(data => {
  promises.push(new Promise(resolve => {
loadImage(data.url).then(img => {
resolve({
  ...data,
  img
})
})
  }))
})
return new Promise(resolve => {
  Promise.all(promises).then(imgDatas => {
imgDatas.forEach(imgData => {
  that.drawImage(imgData.img, imgData.x, imgData.y)
})
resolve(imgDatas)
  })
})
  }
  /**
   * 绘制一张图片
   * @param image
   * @param x
   * @param y
   * @param width
   * @param height
   */
  drawImage(image, x, y, width, height) {
const that = this
width = width || image.width
height = height || image.height
that.ctx.drawImage(image, x, y, width, height)
  }
  /**
   * 绘制多个点
   * @param pointsData,[{type: 'circle', size: 4, x: 100, y: 100, icon: ''}]
   */
  drawPoints(pointsData = []) {
const that = this
return new Promise(resolve => {
  let promises = []
  pointsData.forEach(pointData => {
that.ctx.beginPath()
that.ctx.save()
that.ctx.fillStyle = pointData.color || 'rgba(255, 0, 0, 1)'
const type = pointData.type || 'circle'
const size = pointData.size || 4
let {x, y} = pointData
pointData.x = x
pointData.y = y
switch (type) {
  case "rect": {
x -= size
y -= size
that.ctx.fillRect(x, y, size * 2, size * 2)
promises.push(Promise.resolve(pointData))
break
  }
  case "circle": {
that.ctx.arc(x, y, size, 0, Math.PI * 2)
that.ctx.fill()
promises.push(Promise.resolve(pointData))
break
  }
  case "marker": {
promises.push(new Promise(resolve1 => {
  loadImage(pointData.icon).then(img => {
const w = img.width * pointData.size
const h = img.height * pointData.size
x -= w / 2
y -= h / 2
that.drawImage(img, x, y, w, h)
resolve(pointData)
  })
}))
break
  }
}
that.ctx.restore()
  })
  Promise.all(promises).then(res => {
resolve({
  code: '200'
})
  })
})
  }
  /**
   * 绘制线
   * @param linesData [{}]
   * @return {Promise<unknown>}
   */
  drawLines(linesData) {
const that = this
return new Promise(resolve => {
  linesData.forEach(lineData => {
that.ctx.beginPath()
that.ctx.save()
that.ctx.strokeStyle = lineData.color || 'red'
that.ctx.lineWidth = lineData.width || 2
that.ctx.setLineDash(lineData.dasharray || [5, 0]);
lineData.coords.forEach((coord, index) => {
  const [x, y] = coord
  index === 0 ? that.ctx.moveTo(x, y) : that.ctx.lineTo(x, y)
})
that.ctx.stroke()
that.ctx.restore()
  })
  resolve({
code: '200'
  })
})
  }
  /**
   * 绘制多边形
   * @param polygonsData
   * @return {Promise<unknown>}
   */
  drawPolygons(polygonsData) {
const that = this
return new Promise(resolve => {
  polygonsData.forEach(polygonData => {
that.ctx.beginPath()
that.ctx.save()
polygonData.coords.forEach((coord, index) => {
  const [x, y] = coord
  index === 0 ? that.ctx.moveTo(x, y) : that.ctx.lineTo(x, y)
})
that.ctx.closePath()
if(polygonData.isFill) {
  that.ctx.fillStyle = polygonData.fillStyle || 'rgba(255, 0, 0,  0.2)'
  that.ctx.fill()
}
if(polygonData.isStroke) {
  that.ctx.strokeStyle = polygonData.strokeStyle || 'red'
  that.ctx.lineWidth =  polygonData.lineWidth || 2
  that.ctx.setLineDash(polygonData.lineDash || [5, 0]);
  that.ctx.stroke()
}
that.ctx.restore()
  })
  resolve({
code: '200'
  })
})
  }
  /**
   * 获取canvas数据
   * @return {string}
   */
  getDataUrl() {
return this.canvas.toDataURL().replace(/^data:image\/\w+;base64,/, '')
  }
  /**
   * 添加标题
   * @param title
   */
  addTitle(title) {
this.ctx.save()
this.ctx.strokeStyle = '#fff'
this.ctx.lineWidth = 3
this.ctx.fillStyle = '#fff'
let x = 20, y = 20, offset = 8
let h = 32
this.ctx.font = `bold ${h}px 微软雅黑`
this.ctx.textAlign = 'left'
this.ctx.textBaseline = 'top'
let w = this.ctx.measureText(title).width
// 外边框
this.ctx.strokeRect(x, y, offset * 4 + w, offset * 4 + h)
// 内边框
this.ctx.strokeRect(x + offset, y + offset, offset * 2 + w, offset * 2 + h)
// 文字
this.ctx.fillText(title, x + offset * 2, y + offset * 2)
this.ctx.restore()
  }
}
module.exports = CanvasUtil
tile.js,切片操作工具,提供了坐标转换的方法、获取范围内的切片的行列范围、地理坐标转换为屏幕坐标等方法。
const proj4 = require('proj4')
const { randomNum } = require('./common')
class TileUtil {
  constructor(tileSize = 256) {
this.tileSize = tileSize
this.origin = 20037508.34
this.resolutions = []
let resolution = (this.origin * 2) / this.tileSize
for (let i = 0; i < 23; i++) {
  this.resolutions.push(resolution)
  resolution /= 2
}
this.tileUrl = 'https://webst0{domain}.is.autonavi.com/appmaptile?style=6&x={x}&y={y}&z={z}'
  }
  /**
   * 4326转3857
   * @param lonlat
   * @return {*}
   */
  fromLonLat(lonlat) {
return proj4('EPSG:4326', 'EPSG:3857', lonlat)
  }
  /**
   * 3857转4326
   * @param coords
   * @return {*}
   */
  toLonLat(coords) {
return proj4('EPSG:3857', 'EPSG:4326', coords)
  }
  /**
   * 获取范围内的切片的行列号的范围
   * @param zoom
   * @param extent
   * @return {number[]}
   */
  getTilesInExtent(zoom, extent) {
extent = this.getExtent(extent)
const [xmin, ymin, xmax, ymax] = extent
const res = this.resolutions[zoom] * 256
const xOrigin = -this.origin, yOrigin = this.origin
const _xmin = Math.floor((xmin - xOrigin) / res)
const _xmax = Math.ceil((xmax - xOrigin) / res)
const _ymin = Math.floor((yOrigin - ymax) / res)
const _ymax = Math.ceil((yOrigin - ymin) / res)
return [_xmin, _ymin, _xmax, _ymax]
  }
  /**
   * 获取切片地址
   * @param x
   * @param y
   * @param z
   * @return {string}
   */
  getTileUrl(x, y, z) {
let url = this.tileUrl.replace(/\{x\}/g, x)
url = url.replace(/\{y\}/g, y)
url = url.replace(/\{z\}/g, z)
return url.replace(/\{domain\}/g, randomNum())
  }
  /**
   * 获取切片大小
   * @return {number}
   */
  getTileSize() {
return this.tileSize
  }
  /**
   * 地理坐标转换为屏幕坐标
   * @param extent
   * @param zoom
   * @param lonLat
   * @return {*[]}
   */
  project(extent, zoom, lonLat) {
const [xmin, ymin, xmax, ymax] = this.getTilesInExtent(zoom, extent)
const res = this.resolutions[zoom]
const resMap = this.tileSize * res
const topLeft = [
  resMap * xmin - this.origin,
  this.origin - resMap * ymin
]
const coords = this.fromLonLat(lonLat)
const x = (coords[0] - topLeft[0]) / res
const y = (topLeft[1] - coords[1]) / res
return [x, y]
  }
  /**
   * 处理四至
   * @param extent
   * @return {*[]}
   */
  getExtent(extent) {
if(Boolean(extent)) {
  const min = this.fromLonLat([extent[0], extent[1]])
  const max = this.fromLonLat([extent[2], extent[3]])
  extent = [...min, ...max]
} else {
  extent = [-this.origin, -this.origin, this.origin, this.origin]
}
return extent
  }
  /**
   * 判断是否在范围内
   * @param extent
   * @param lonLat
   * @return {boolean}
   */
  isInExtent(extent, lonLat) {
const [xmin, ymin, xmax, ymax] = extent
const [lon, lat] = lonLat
return lon >= xmin && lon <= xmax && lat >=ymin && lat <= ymax
  }
}
module.exports = TileUtil
map.js,实现地图导出,会用到前面提到的两个工具类。
const fs = require('fs');
const ora = require('ora'); // loading
const TileUtil = require('./utils/tile')
const CanvasUtil = require('./utils/canvas')
const spinner = ora('tile joint').start()
const tileUtil = new TileUtil()
const z = 5
// const extent = undefined
const extent = [73.4469604492187500,6.3186411857604980,135.0858306884765625,53.5579261779785156]
const [xmin, ymin, xmax, ymax] = tileUtil.getTilesInExtent(z, extent)
const width = (xmax - xmin) * tileUtil.getTileSize()
const height = (ymax - ymin) * tileUtil.getTileSize()
const canvasUtil = new CanvasUtil(width, height)
let urls = []
for(let i = xmin; i < xmax; i++) {
  const x = (i - xmin) * tileUtil.getTileSize()
  for(let j = ymin; j < ymax; j++) {
const y = (j - ymin) * tileUtil.getTileSize()
const url = tileUtil.getTileUrl(i, j, z)
urls.push({
  i, j, x, y, url
})
  }
}
// 添加点数据
function addCapitals() {
  let geojson = fs.readFileSync('./data/capital.json')
  geojson = JSON.parse(geojson)
  let pointsData = []
  geojson.features.forEach(feature => {
const coords = feature.geometry.coordinates
if(!extent || tileUtil.isInExtent(extent, coords)) {
  const [x, y] = tileUtil.project(extent, z, coords)
  const { name } = feature.properties
  if(name === '北京') {
pointsData.push({type: 'marker', size: 0.35, x, y, icon: './icons/icon-star.png'})
  } else {
pointsData.push({type: 'rect', size: 4, x, y, color: '#ff0'})
  }
}
  })
  return canvasUtil.drawPoints(pointsData)
}
// 添加线数据
function addLines() {
  let geojson = fs.readFileSync('./data/boundry.json')
  geojson = JSON.parse(geojson)
  let linesData = []
  geojson.features.forEach(feature => {
const {type, coordinates} = feature.geometry
if(type === 'LineString') {
  linesData.push({
width: 2,
color: 'rgba(255,0,0,0.8)',
coords: coordinates.map(coords => {
  return tileUtil.project(extent, z, coords)
})
  })
} else {
  coordinates.forEach(_coordinates => {
linesData.push({
  width: 2,
  color: 'rgba(255,0,0,0.8)',
  coords: _coordinates.map(coords => {
return tileUtil.project(extent, z, coords)
  })
})
  })
}
  })
  return canvasUtil.drawLines(linesData)
}
// 添加面数据
function addPolygons() {
  let geojson = fs.readFileSync('./data/province.geojson')
  geojson = JSON.parse(geojson)
  let polygonsData = []
  geojson.features.forEach(feature => {
const { name } = feature.properties
const {type, coordinates} = feature.geometry
if(type === 'Polygon') {
  const coords = coordinates[0].map(coords => {
return tileUtil.project(extent, z, coords)
  })
  polygonsData.push({
isStroke: true,
isFill: true,
lineWidth: 1,
lineDash: [5, 5],
strokeStyle: 'rgb(240,240,240)',
fillColor: 'rgba(255, 0, 0,  0.1)',
coords,
name
  })
} else {
  coordinates[0].forEach(_coordinates => {
const coords = _coordinates.map(coords => {
  return tileUtil.project(extent, z, coords)
})
polygonsData.push({
  isStroke: true,
  isFill: true,
  lineWidth: 1,
  lineDash: [5, 5],
  strokeStyle: 'rgb(240,240,240)',
  fillStyle: 'rgba(255, 0, 0,  0.1)',
  coords,
  name
})
  })
}
  })
  return canvasUtil.drawPolygons(polygonsData)
}
// 1.拼接切片,2.添加面数据,3.添加点数据,4.添加线数据,5.导出图片
canvasUtil.drawImages(urls).then(() => {
  addPolygons().then((a) => {
addCapitals().then(() => {
  addLines().then(() => {
canvasUtil.addTitle('中国省级区划图')
let base64Data = canvasUtil.getDataUrl()
let dataBuffer = Buffer.from(base64Data, 'base64')
fs.writeFileSync(`./result/map${z}.png`, dataBuffer)
spinner.succeed()
spinner.color = 'green'
  })
})
  })
})
本文源代码请扫描下面二维码或直接前往仓库获取。
 战神老婆受不了,求我下山
 重新开始,我不需要你
 踹掉渣男后,我成了太子妃
 强取豪夺:疯批国师掌中娇
 风月难逃
风月难逃 开局陷死局,绝美女帝要卸磨杀驴
 再见老公
再见老公 何秋若付渐成
 清宁桃花
清宁桃花 官运权途
官运权途 妈妈想让我替弟弟高考
 绝世高手张宇
 广城的初夏都特别热许雨晴
 虞溪蔷沈泊礼
 天才萌宝:妈咪只想当咸鱼
 我穿成了小说里的贫穷路人甲